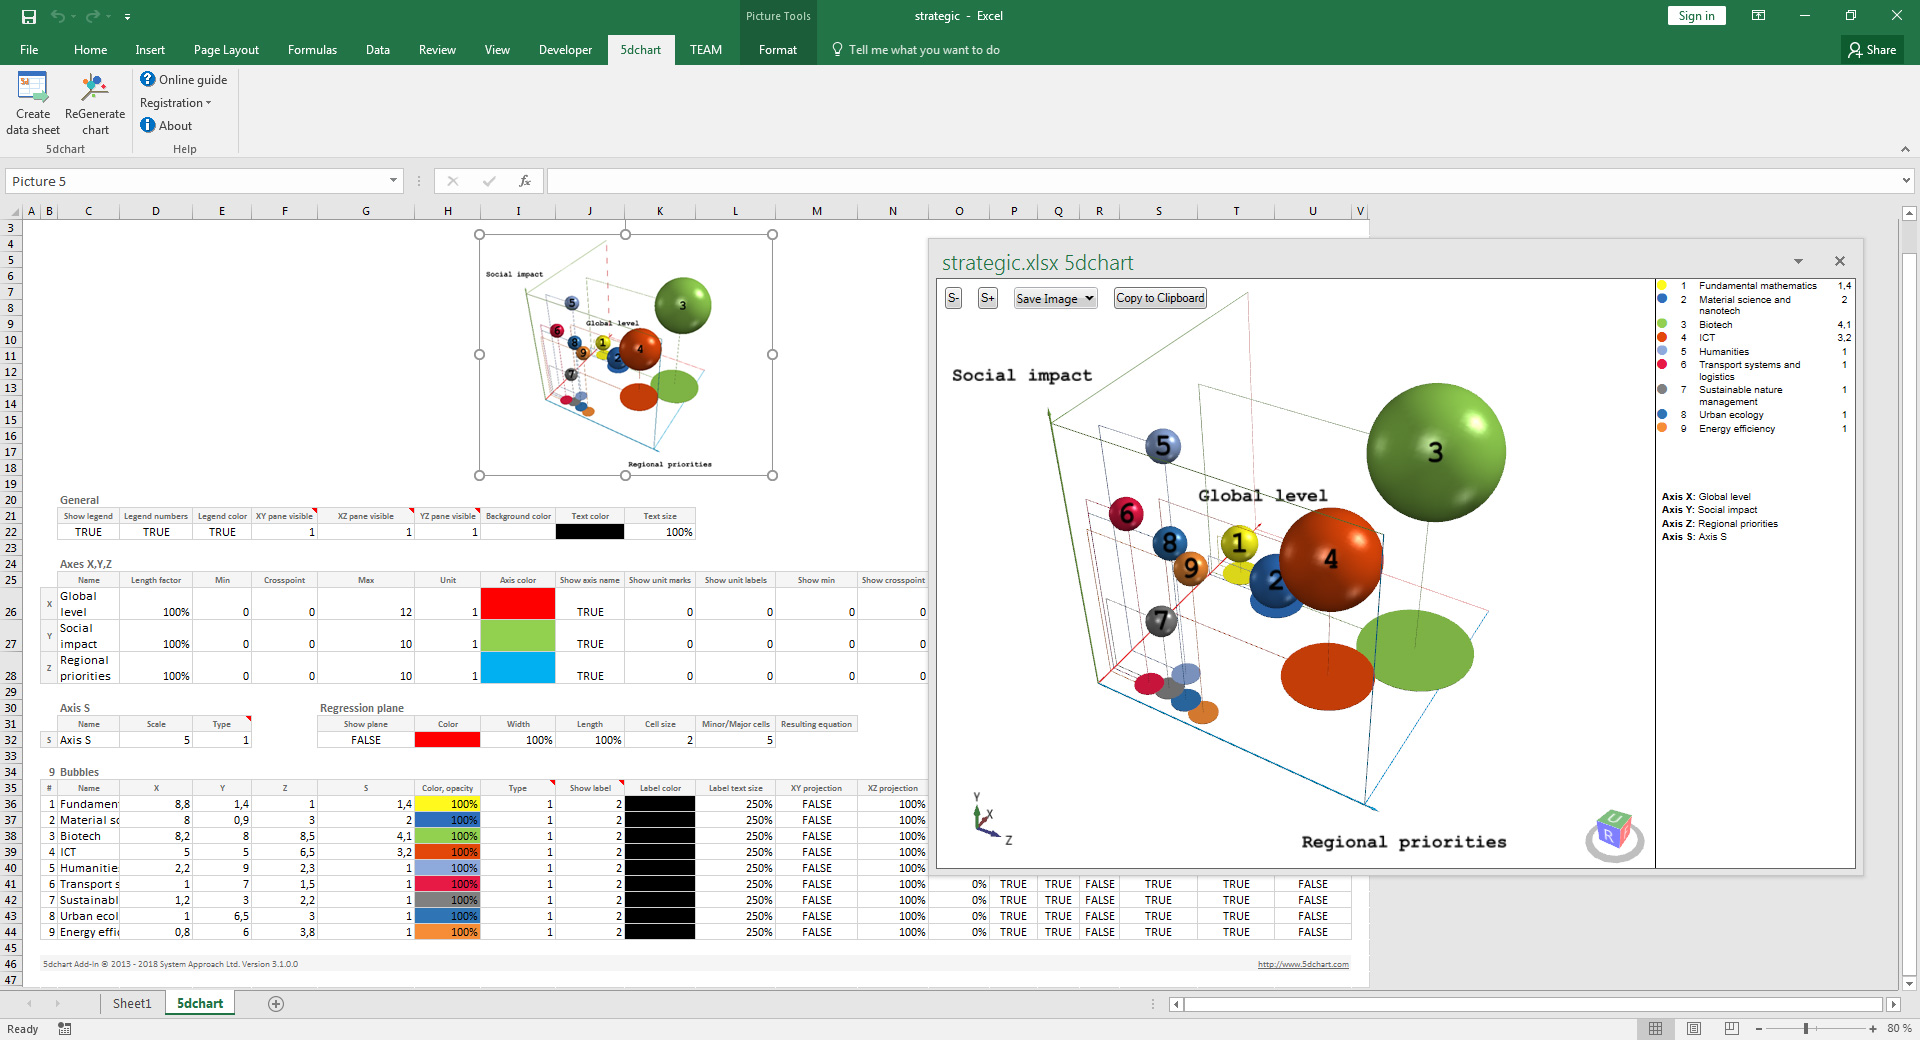
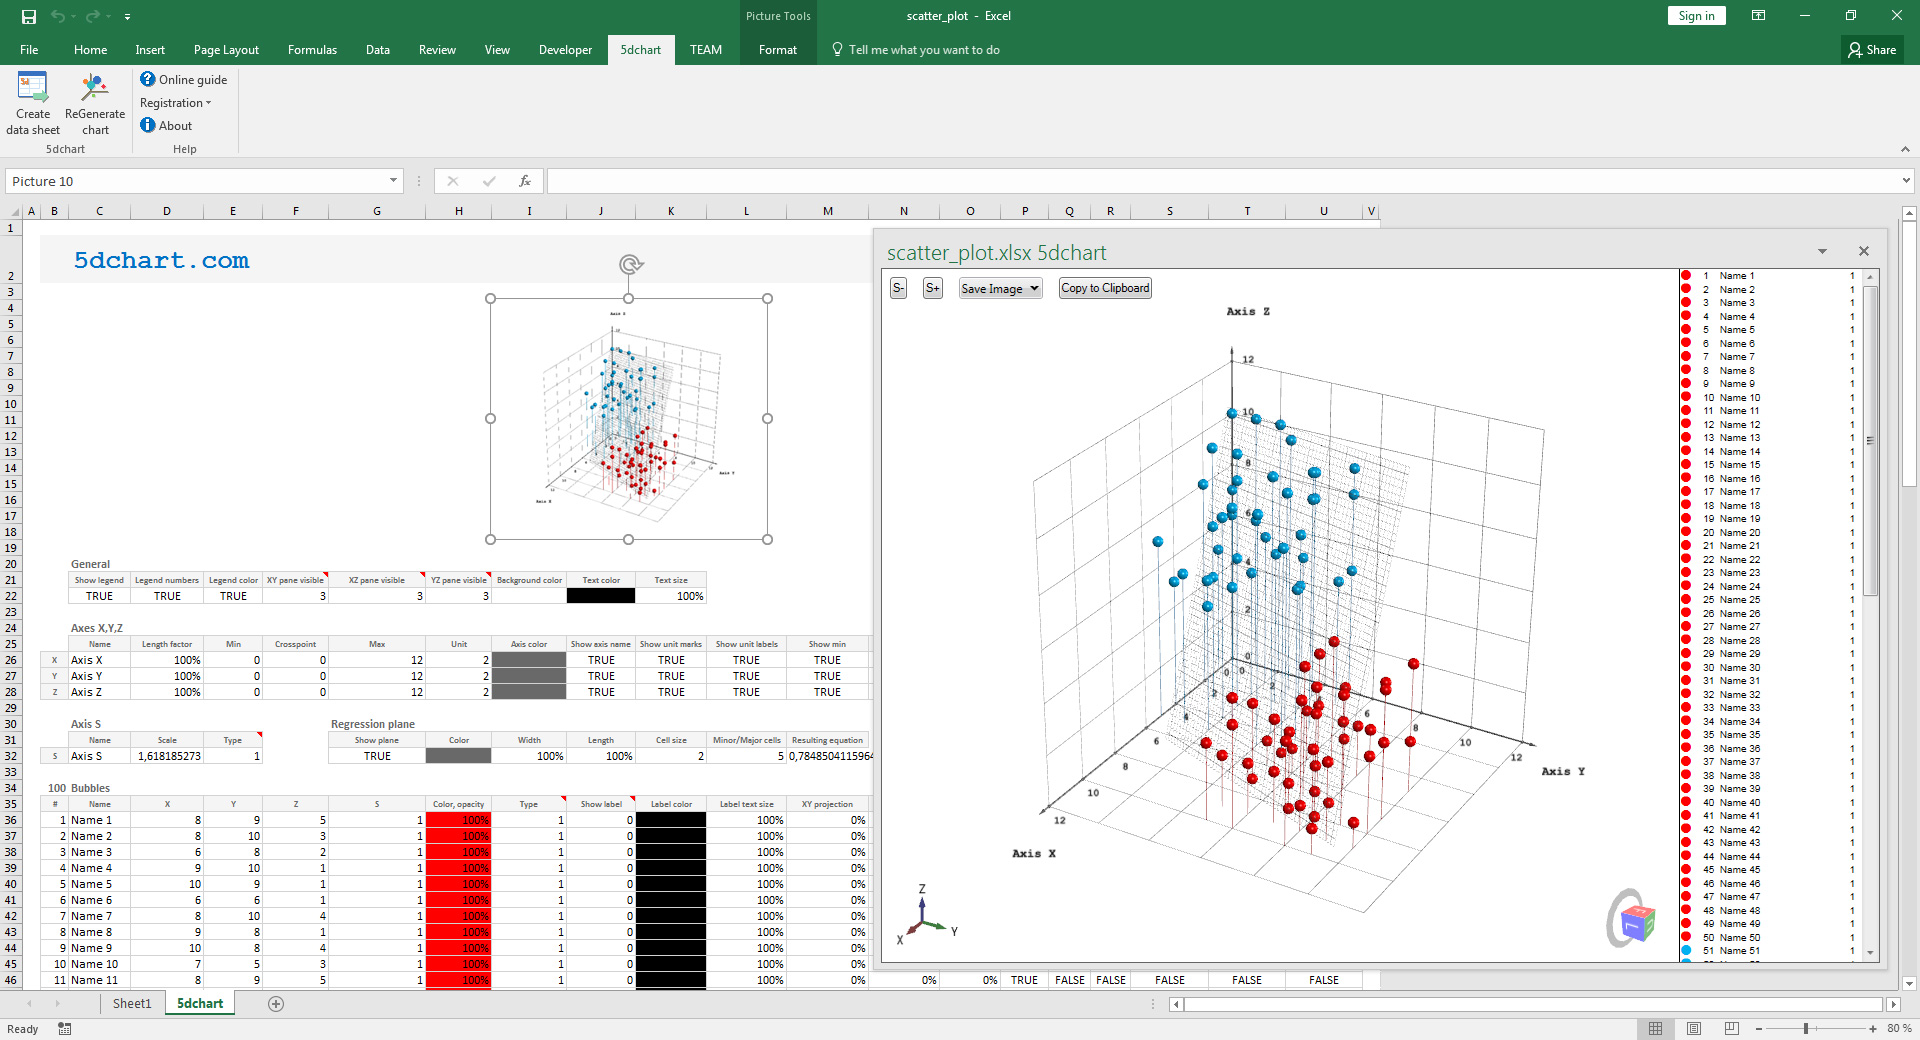
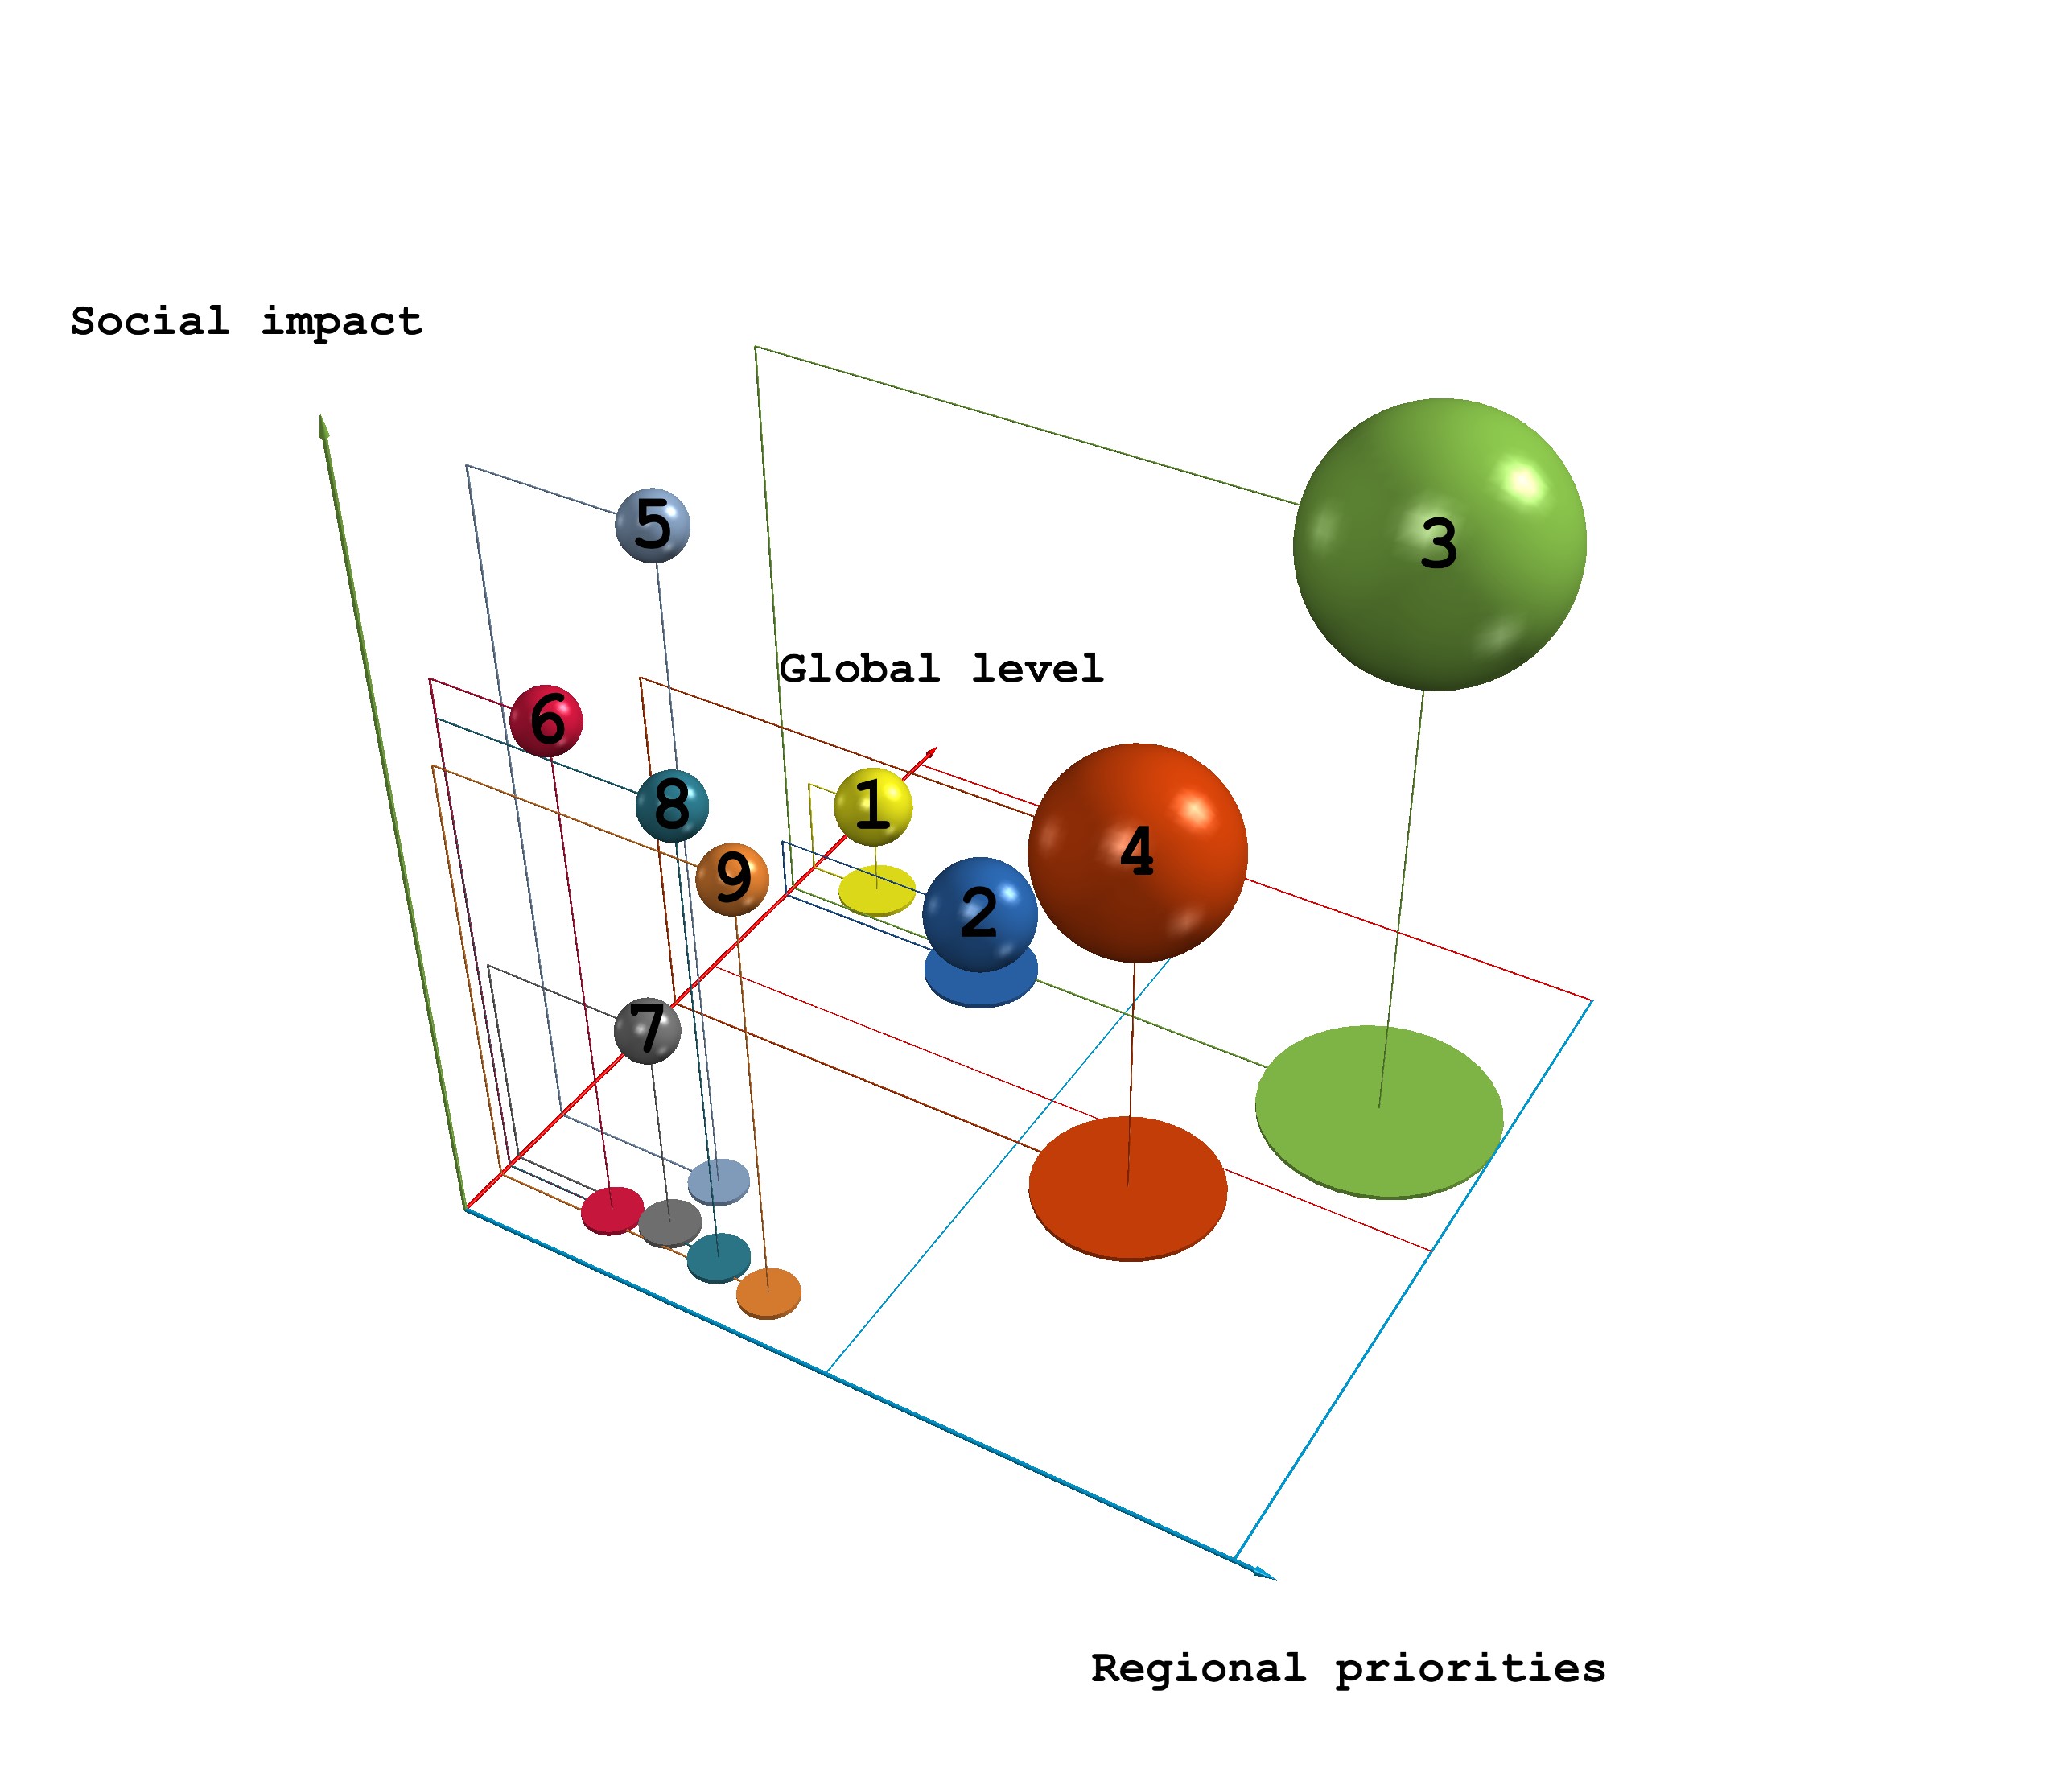
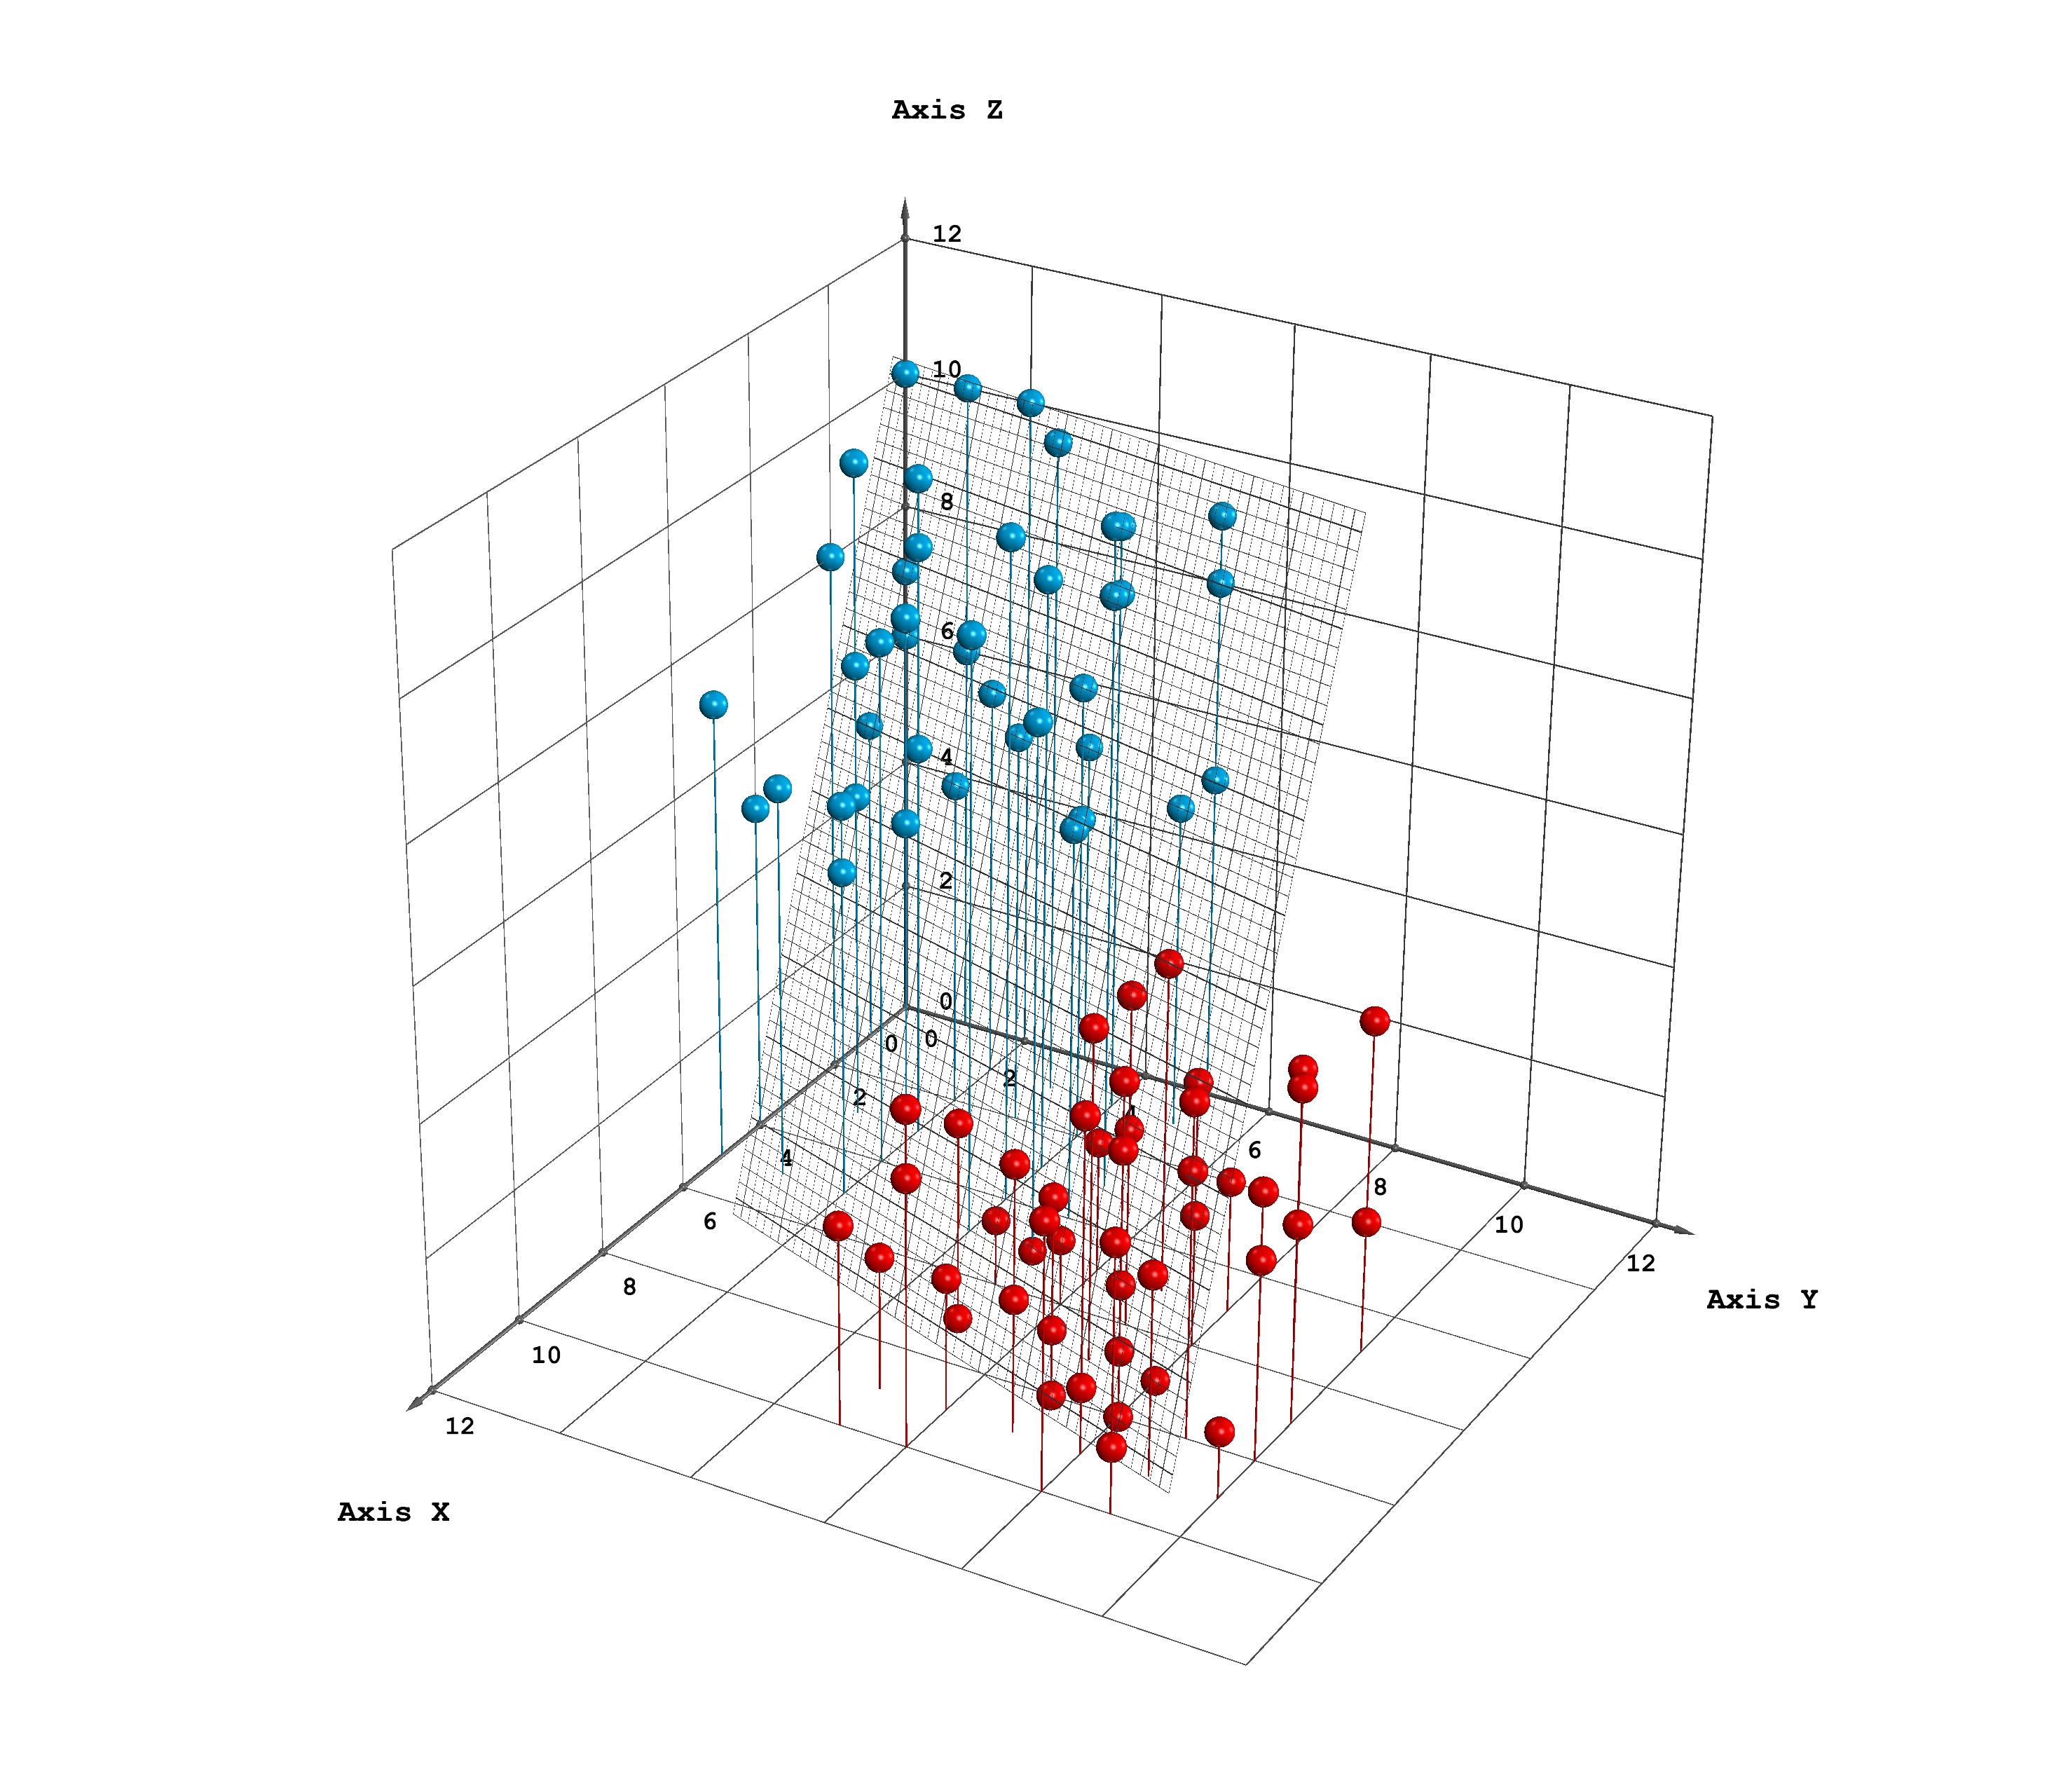
5dchart Add-In (for Microsoft Excel) is an easy-to-use tool for multi-dimensional data visualization. It allows you to display a real 3D bubble chart with additional parameters: 3D coordinates of each bubble, bubble size, type and colour. Of course, it is the easy way to create 3D scatter plot too. Also you can compute the best fit plane equation using least squares and display a 3D regression plane easily!
5dchart Add-In is designed to allow 3D bubble chart and scatterplot drawing directly in Microsoft Excel without using any standalone applications.
We believe it’s one of the most sophisticated 3D drawing tools for Microsoft Excel.
But don’t take our word for it. Try 5dchart Add-In now and see for yourself!

